A clean, fast, no-nonsense river level dashboard built by (and for) NW England fly anglers.
Live at: https://riverdipstick.uk
How it works
There’s a collector that runs on the live server every fifteen minutes. It grabs real-time levels from the Environment Agency (and SEPA in Scotland), rainfall, and pressure (Open-Meteo observations + forecasts), writes it all into a database and applies “good fishing band” rules.
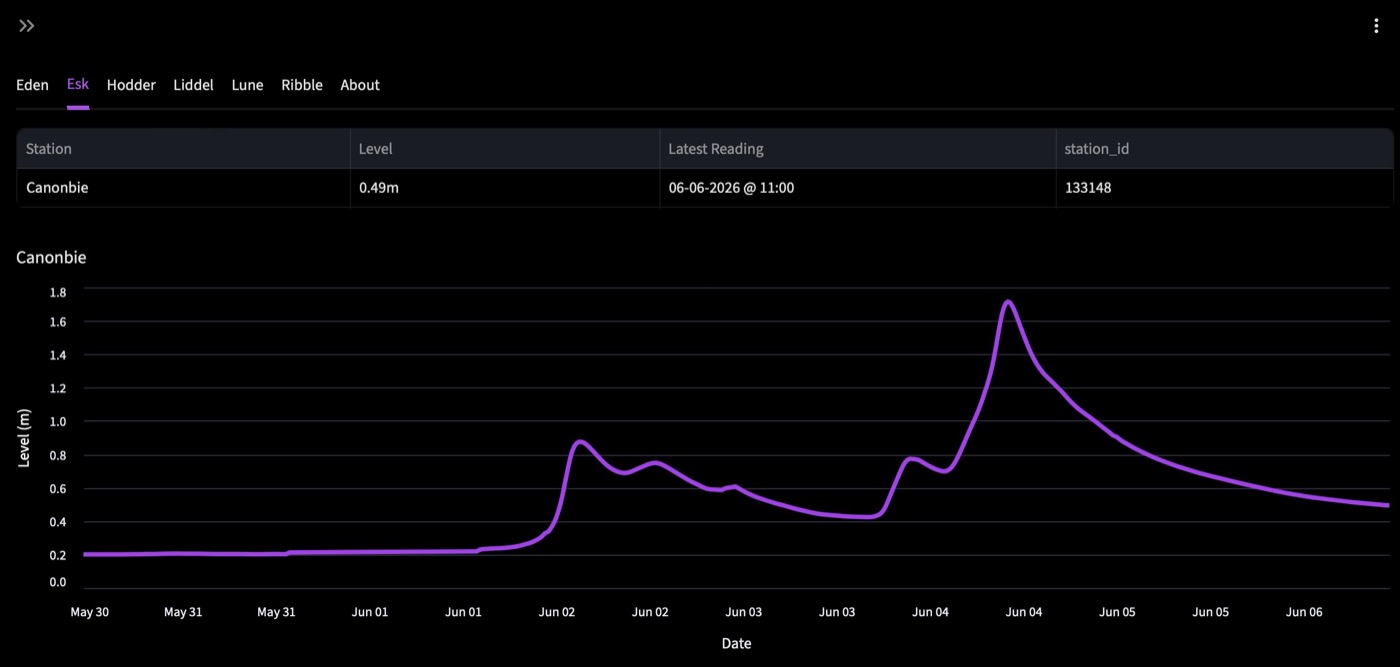
The public facing site is a clean dashboard at riverdipstick.uk with tables, graphs. It shows real-time levels (updated every 15 mins), rainfall history overlays, pressure trends, and — most usefully for me — static light green “Good Fishing Band” on selected the charts (based on local some wisdom). You can toggle “Extend Charts” to give you space to eyeball trends, look at maps of the stations, and slide the history slider for archived river level data.
How to use it
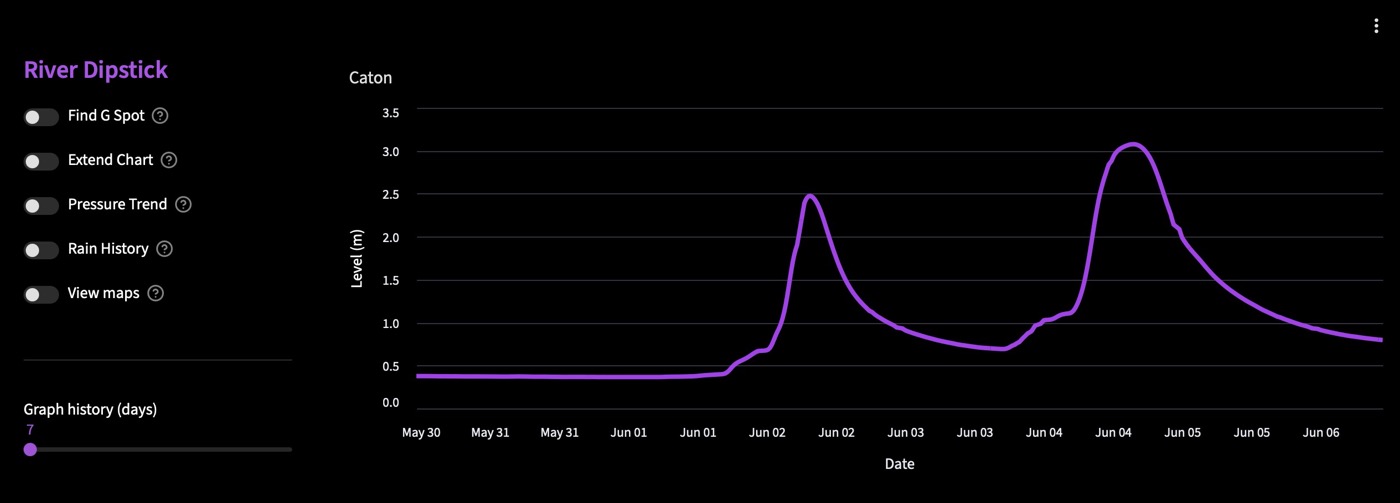
- Access the sidebar by selecting the menu >> in the top lefthand corner of the site.
- Select ‘Find G Spot’ to highlight good fishing levels on selected charts, based on local wisdom (where it exists).
- When viewing the ‘Good Fishing Band’ on a chart; remember… a falling river is always best.
- Select ‘Extend Chart’ for space to eyeball trends.
- Select ‘Pressure Trend’ to stitch together recent pressure readings with forecasted atmospheric pressure.
- Select ‘Rainfall History’ to view recent rainfall data.
- Select ‘Maps’ to see where the measuring station is located.
- Use the ‘Graph History’ slider to show more or less data on the charts.
- Don’t spend too long looking at data, if in doubt… go fishing 😊
Data Sources
- Environment Agency (EA) – Real-time river levels and historic rainfall
- SEPA – Real-time river levels (Scotland)
- Open-Meteo – Atmospheric pressure observations and forecasts
Philosophy
This site is deliberately simple. After months of testing, real-world experience showed that complex (ML) predictions weren’t as useful as hoped. We now trust in the Mark 1 Eyeball.
The goal: Give fellow local anglers a fast, reliable tool to decide “Is it worth going?”
Current features include real-time levels (updated every 15 minutes), rainfall history, pressure trends with forecasts, “Predict Level” for future eyeballing, and the green Good Fishing Band zones is a work in progress, currently its based on my personal (limited) experience.
I tried using AI and Machine Learning to predict levels and good fishing levels but it sent me half crazy and was useless. In the future I hope to show a ‘good fishing level’ on each beat from information gathered from the community. Maybe its secret squirrel information that nobody wants to share or maybe we can do a good thing for fellow fisherman?
Feedback
If something’s broken or you’ve got a suggestion for a new feature that might be useful for us fishing nerds, let me know here or on the riverdipstick site.
Leave a Reply